https://streambee.io/core/cache/breeze-minification/js/breeze_cd266c651f9977d1c8dcfaa58d65b040.js
https://streambee.io/core/cache/breeze-minification/js/breeze_5a837e19d55d956ace4562adce152b9b.js
https://streambee.io/core/cache/breeze-minification/js/breeze_14851a51f9b7ec7211cb89bcd1f0cb54.js
https://streambee.io/core/cache/breeze-minification/js/breeze_ee3c73796961e5a7276de337bb90b048.js
https://streambee.io/core/cache/breeze-minification/js/breeze_c2a4df636365c870fad56f9a73f07d61.js
https://streambee.io/core/cache/breeze-minification/js/breeze_3cb80c9afd531c7fe585170c1daf7e1d.js
https://streambee.io/core/cache/breeze-minification/js/breeze_252238eec0aa8cbafe49ae03293d7e9c.js
https://streambee.io/core/cache/breeze-minification/js/breeze_c79838671795cfcb5b282bfaa0fa89d2.js
https://streambee.io/core/cache/breeze-minification/js/breeze_644bb3d85a8d8f9fef0d3f0c1c4b7a9b.js
https://streambee.io/core/cache/breeze-minification/js/breeze_79fdbd25fcea37749ec8a84ff1ce7224.js
https://streambee.io/core/cache/breeze-minification/js/breeze_2123fcd2172f5f561d8916cbf54059cc.js
https://streambee.io/core/cache/breeze-minification/js/breeze_0fea02c5bb1cbacdcde81a82a302cc17.js
https://streambee.io/core/cache/breeze-minification/js/breeze_17da0e163cd9238c6d03ca584f7a9767.js
https://streambee.io/core/cache/breeze-minification/js/breeze_9de315004527d2897b7e39eed72a7f8d.js
https://streambee.io/core/cache/breeze-minification/js/breeze_0f1a979c04e07a51f2945a750edc2388.js
https://streambee.io/core/cache/breeze-minification/js/breeze_07e7d8ee058ad99b20b0921ed97bf446.js
The stream overview tab explained
In this article, we would like to explain every single metric from our overview tab in the StreamBee Analytics platform.
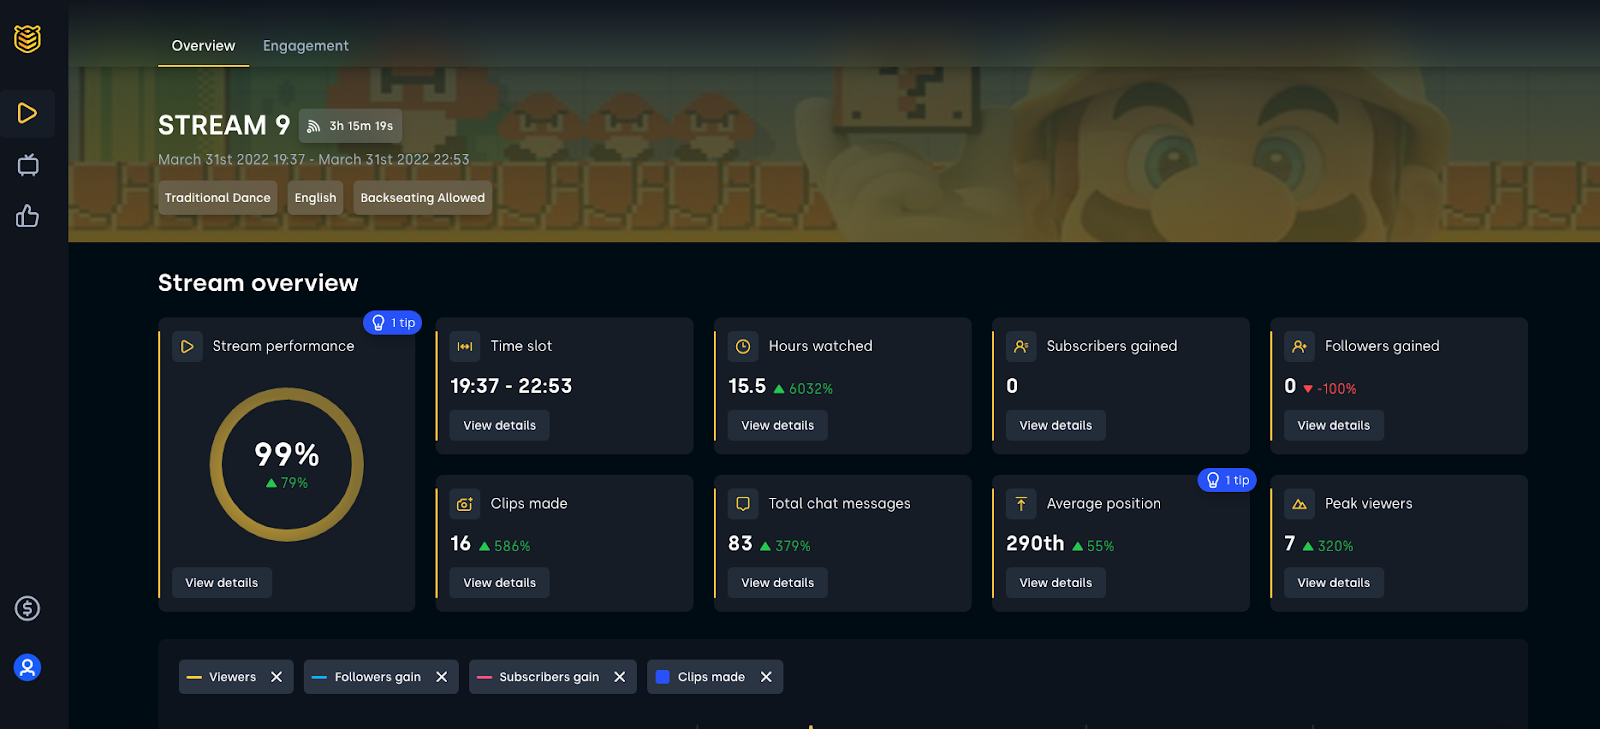
Cards
Stream performance
The estimated performance for this stream compared with previous streams.
Time slot
The time this stream started and ended, then compared with previous streams in the context of viewers.
Hours watched
Total hours watched by the viewers during this stream.
Subscriber gained
Subscribers gained during this stream.
Followers gained
Followers gained during this stream.
Actionable tips
The main benefit of StreamBee Analytics are personalized actionable tips. Get them now.
Clips made
Clips that were made during this stream.
Total chat messages
Chat messages that were posted during this stream.
Average position
This stream’s position in the directory during its duration.
Peak viewers
This stream’s moment with the highest viewers.
Unique viewers
Data estimation where every user counts once regardless if they drop or joined again this stream.
Viewers drop rate
Users leaving this stream and compared it with previous streams.
We're on Discord
Join one of the biggest Discord servers for content creators.
Besides these metrics, there are various graphs with self-explanatory statistics. Here is the list:
Timeline graph
- Viewers
- Followers
- Subscribers
- Clips

Content breakdown
- Hours watched
- Peak viewers
- Subscribers gained
- Followers gained
- Clips made
Clips
- Top 10 most viewed clips
- Thumbnail
- Timestamp
- Duration
- Views
- Game
- Title
- Clip Author
Business intelligence toolkit for content creators.
https://streambee.io/core/cache/breeze-minification/js/breeze_fdd64ab05eac645a27c2c9de7a9a0fef.js
https://streambee.io/core/cache/breeze-minification/js/breeze_707e2a538029d7d1129e910d6fdf34ad.js
https://streambee.io/core/cache/breeze-minification/js/breeze_6b178ae0a728bdae8b04a720a1451ed6.js
https://streambee.io/core/cache/breeze-minification/js/breeze_9982f813a99bcd749addf896174e3479.js
https://streambee.io/core/cache/breeze-minification/js/breeze_85d9daa8b5781ca657e6aa68398f553b.js
https://streambee.io/core/cache/breeze-minification/js/breeze_b485f8be08349b1693ddc4e90a46eab3.js
https://streambee.io/core/cache/breeze-minification/js/breeze_1c68d86d2ab5b8a6f33314dd28ad13fc.js
https://streambee.io/core/cache/breeze-minification/js/breeze_8e9c81b1ee5f4458266eb9efebd8a7d8.js
https://streambee.io/core/cache/breeze-minification/js/breeze_adf77cecaf8280fa4de43f6a6a37e4f8.js
https://streambee.io/core/cache/breeze-minification/js/breeze_dcfc1c57ee5cc9b38a7d519b0a9ef2cc.js
https://streambee.io/core/cache/breeze-minification/js/breeze_58bea7bf45a76c72a897c9ddcaa7e62d.js
https://streambee.io/core/cache/breeze-minification/js/breeze_934f7d385b8b17bb093b73466879b174.js
https://streambee.io/core/cache/breeze-minification/js/breeze_0e89f6fc37712be787d465a2b6dfb283.js
https://streambee.io/core/cache/breeze-minification/js/breeze_c7a0efcb00325b041c1919b7e05ef689.js
https://streambee.io/core/cache/breeze-minification/js/breeze_9299a5c9adf6518c81b157bcf576a47d.js
https://streambee.io/core/cache/breeze-minification/js/breeze_adb9da9b4f91ebd337a06e1ea1f1ef16.js


